Welcome to the Machine Learning part of the blog! Let’s start out with finding the differences between supervised and unsupervised learning. By definition, “the main difference between the two types is that supervised learning is done using a ground truth, or in other words, we have prior knowledge of what the output values for our samples should be. Therefore, the goal of supervised learning is to learn a function that, given a sample of data and desired outputs, best approximates the relationship between input and output observable in the data. Unsupervised learning, on the other hand, does not have labeled outputs, so its goal is to infer the natural structure present within a set of data points.” (towardsdatascience.com). What this means is that supervised learning is telling the computer what’s wrong and what’s right, so it can develop a model to predict possibilities. Whereas, unsupervised learning is mainly used for hierarchical clustering – basically grouping data together. A good example of supervised learning is predicting if someone will have cancer or not based on a sample set. A good example of unsupervised learning is grouping web pages together so if someone searches up a key word, it will display relevant sources.
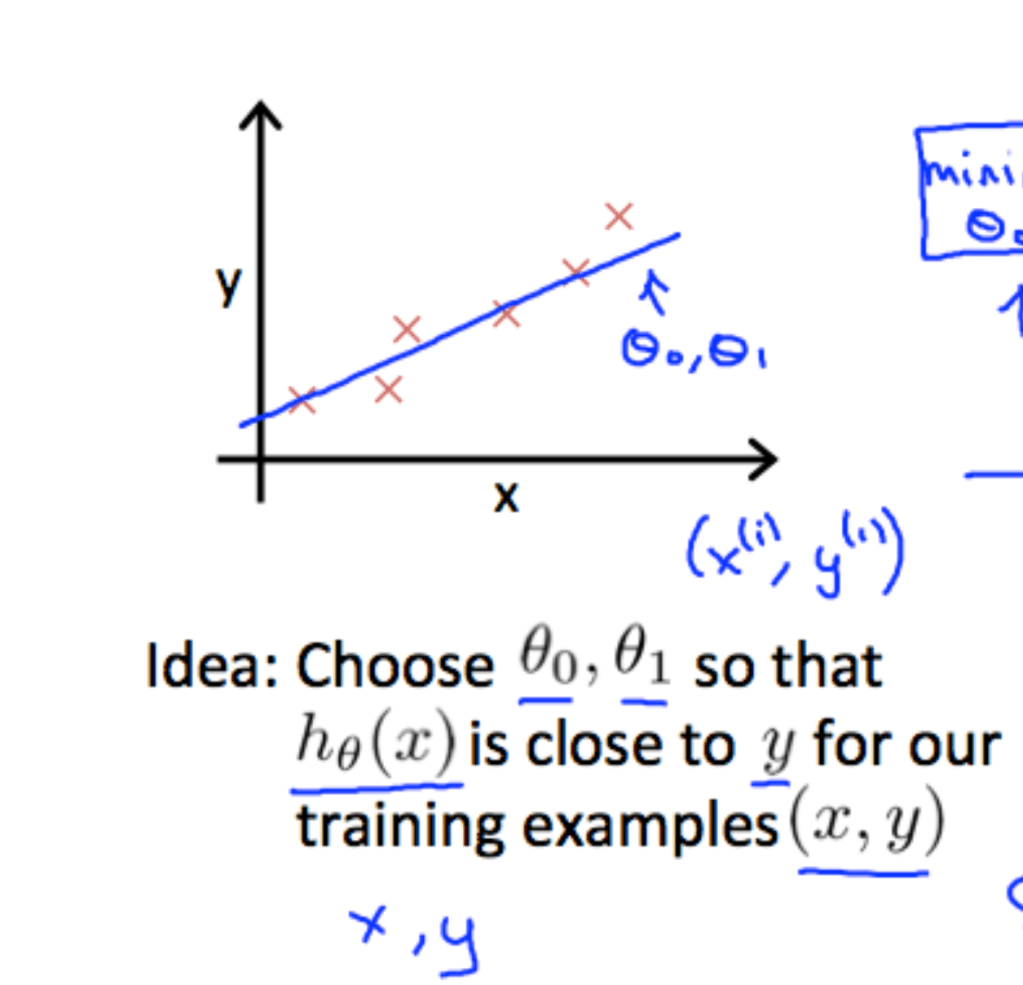
Now lets go into the math for developing an accurate formula for a supervised learning problem. Lets say that we have a graph of the size of house vs cost. Our goal is to analyze that data so we can create a model that can effectively predict what the cost of a specific size house is. As we can see from the graph (Fig-1), the best graph to make is a linear regression line. However, for the computer to recognize this is another mystery. So we want to make our hypotheses a linear line; y = mx + b. However, in machine learning we give it different syntax and say that h(x) [the hypothesis] = (theta1)x + (theta). Our goal is to choose theta and theta one so that when we plug in every x coordinate of the data set into the function h(x), the result will be as close as possible to the corresponding y value. To see how far off our line is from each of our data points we use a sort of complex formula called the work or cost function J(theta, theta1). There is another article here which can give you more information on the function mathematically.
